Control Network Newsletter

Understanding the Graphics and Dashboard Capabilities of the BASview3
BASview3 is a stand-alone, embedded, web-based graphical interface for building automation and process automation systems. It can be accessed from any web browser – providing supervisory functionality to any BACnet/IP or Modbus TCP system. By using Contemporary Controls BASrouter or BASgateway products, additional protocols such as BACnet MS/TP and Modbus RTU are supported.
Supervisory features include animated graphic screens, scheduling, historical trending, runtime accumulation and email alarms. BASview3 will automatically toggle outputs and change setpoints on schedule, collect runtime and trend data, and monitor alarm conditions.
BASview3 supports multiple logins with different user permission levels allowing you to create dashboards and/or graphics for both the service personnel which provide maintenance to the HVAC equipment, as well as the end users/occupants who are interested in comfort parameters, such as current temperature, and state of operation, such as heat/cool/ventilate HVAC modes. Different user permission levels also allow some users to log in and modify (write) parameters such as set points, or only allow viewing (read) of these parameters for other users with lesser permission levels.
BASview3 Graphics
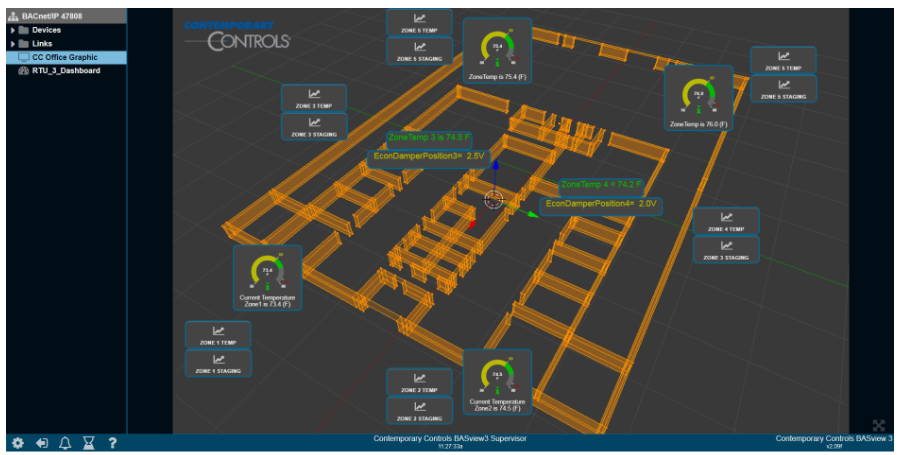
Graphics differentiate from dashboards because integrators configuring the graphic can upload images (PNG, GIF) such as floor plans, mechanical equipment, zone layout, actual picture of a zone/room, etc. to the BASview3 and then freely position animated graphical elements such as gauges, buttons, labels, charts, etc. on top of the image. This gives users insight to zone temperature, zone set point, etc., and gives some control, such as adjusting a setpoint or changing occupancy state. In the example below, a floor plan was generated in a graphical software, saved as a PNG file, and then uploaded to the BASview.
BASview3 Dashboard
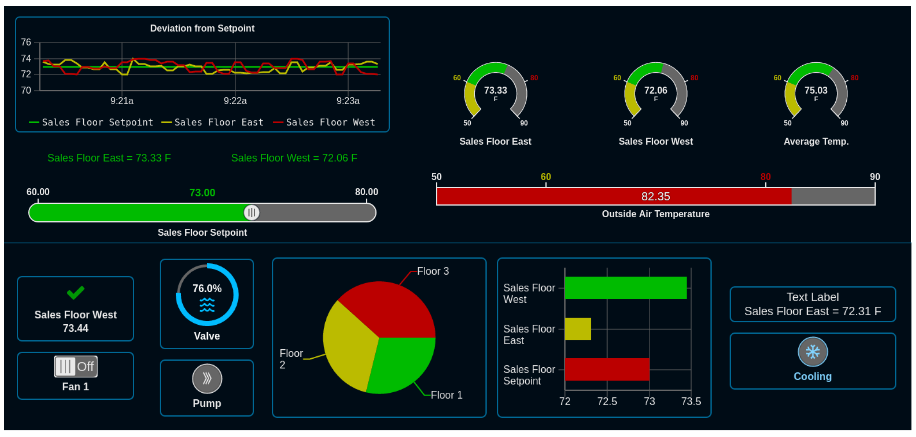
In a dashboard, integrators configuring the dashboard cannot upload images or freely position graphical elements but rather graphical elements/widgets, such as gauges, charts, trend graphs, buttons, labels, icons are placed in containers and positioned on the screen in desired order. This makes dashboards scalable across devices, such as tablets, smart phones and PC monitors. This is ideal for monitoring and/or controlling equipment over the BACnet network. A library of built in widgets is provided as seen in the example below.
By supporting both traditional graphics and the dashboard, BASview3 can clearly display system information and be easily used to control equipment. The BASview3 is ideal for small to medium buildings or processes that require a simple-to-use graphical interface with no licensing requirements. The BASview3 can handle up to 2000 nodes – a combination of devices, points, schedules, alarms, trends, etc.
To learn more, visit the BASview3 product page.