BASview Trending
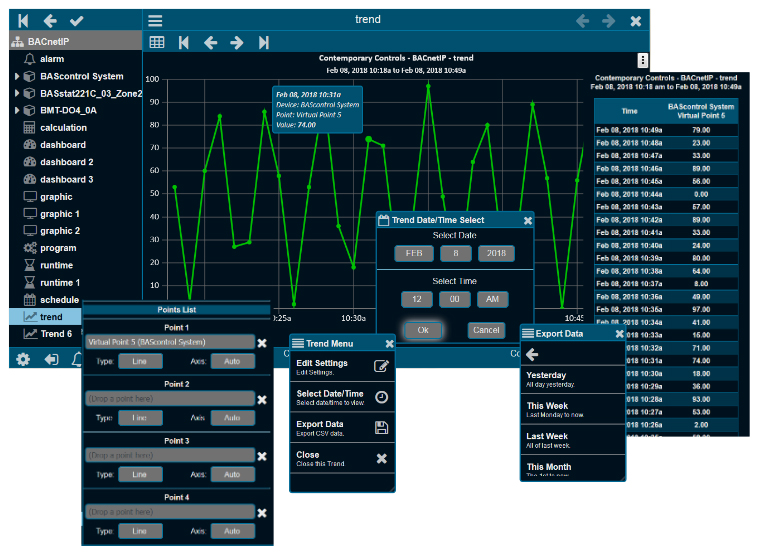
Trends automatically record point values at specified intervals of time to allow for later viewing. Up to six points may be specified for a trend. Both a graphical line chart and a tabular text view are available per trend. A pop-up calendar makes it easy to choose the date and time. An option allows you to export your data.
Using the Chart option, two charts can be displayed simultaneously using the same time base. The vertical axis shows the value of the variable being trended with the horizontal axis displays time. Both scales are automatically adjusted to fit the data currently displayed. Usually, the analogue values are shown on the top chart and the digital values on the bottom chart. A divider bar between the two charts can be moved for better viewing. Up to six variables can be trended on the two charts. In the background a grid shows where the value and time scales intersect. With the mouse hovering over the intersection of a chart line and a grid line, information about the value of the variable at that time is displayed.
The Data tab displays the same data as the chart, but in a tabular text format. The first column is the date/time of the reading. Each point is then listed in order, from left to right. Any column header can be clicked to sort the data by that field. Clicking the header a second time will reverse the sort order. If there is more data than can fit on the screen, a scroll bar will appear to allow scrolling through the data. A mouse wheel may also be used to scroll.
Back to BASview